London & St. Thomas Real Estate Market Report: September 2026
Wednesday, Oct 07, 2026
The September 2026 real estate numbers for London and St. Thomas are in, and they tell an interesting story.
While the average sale price and number of new listings were lower compared with the same period in 2025, the number of homes sold increased. At the same time, inventory remained relatively high at 5.9 months.
For buyers and sellers, these numbers are a useful reminder that the market cannot be understood by looking at one statistic alone.
Price, inventory, new listings and sales activity all work together to provide a clearer picture of what is happening.
Here is a closer look at the September 2026 London and St. Thomas real estate market and what these numbers may mean if you are considering buying or selling a home.
September 2026 Market at a Glance
According to the September 2026 market data:
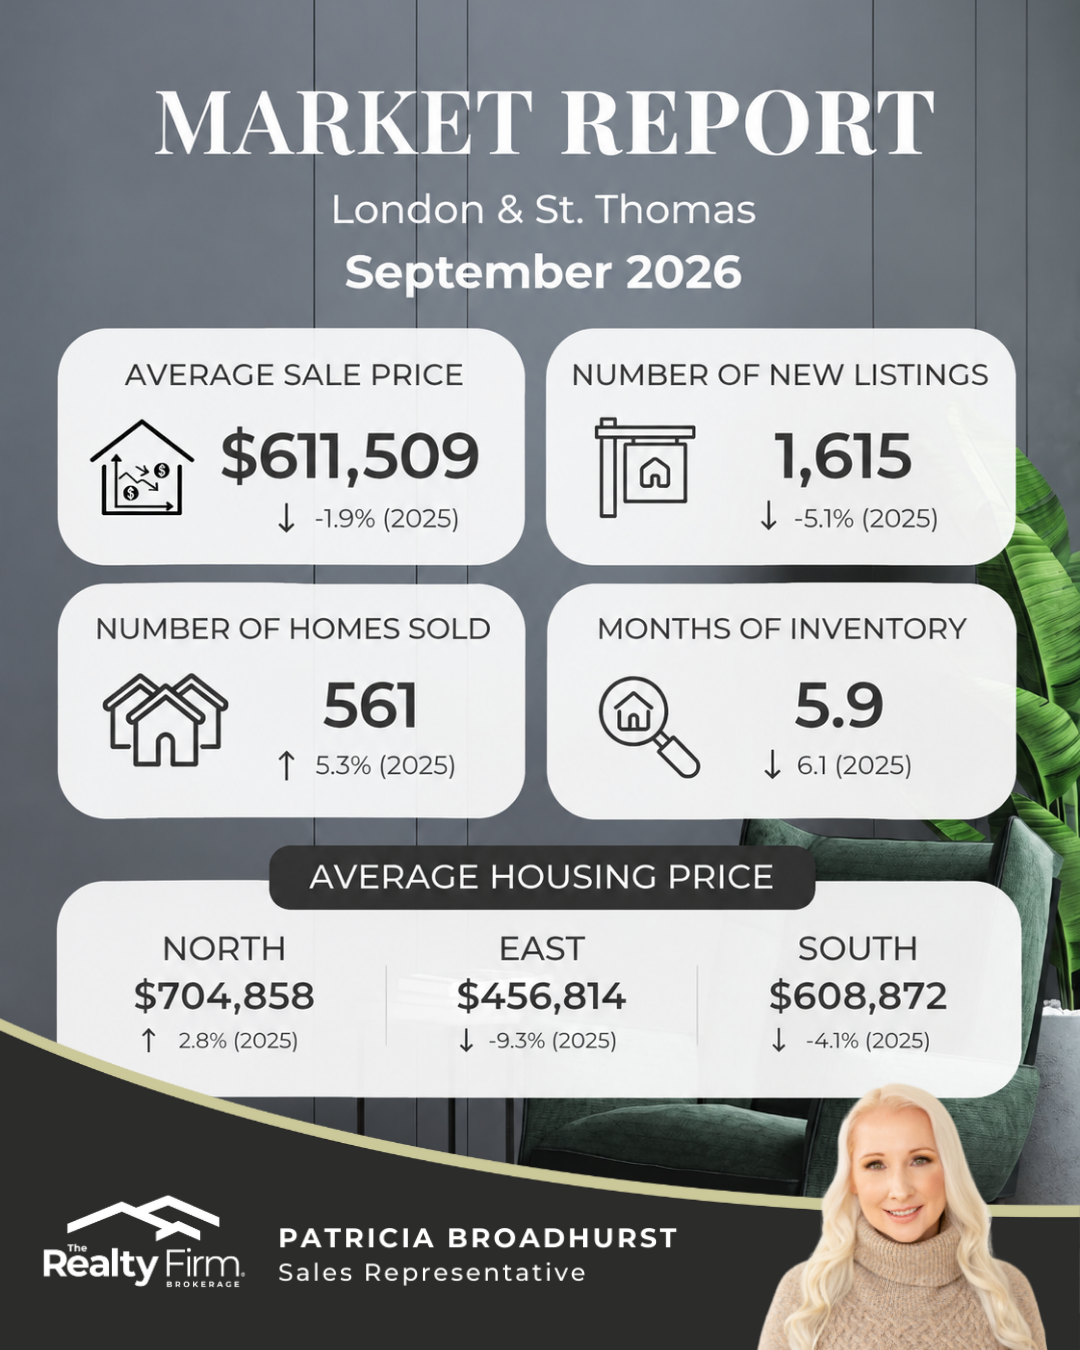
Average Sale Price: $611,509
Change from 2025: Down 1.9%
Number of New Listings: 1,615
Change from 2025: Down 5.1%
Number of Homes Sold: 561
Change from 2025: Up 5.3%
Months of Inventory: 5.9
September 2025: 6.1 months
These numbers show a market with several forces working at the same time.
Prices were slightly lower compared with the previous year, and fewer new properties came onto the market. However, more homes sold than during the comparable period in 2025.
That makes the increase in sales activity one of the more notable numbers this month.
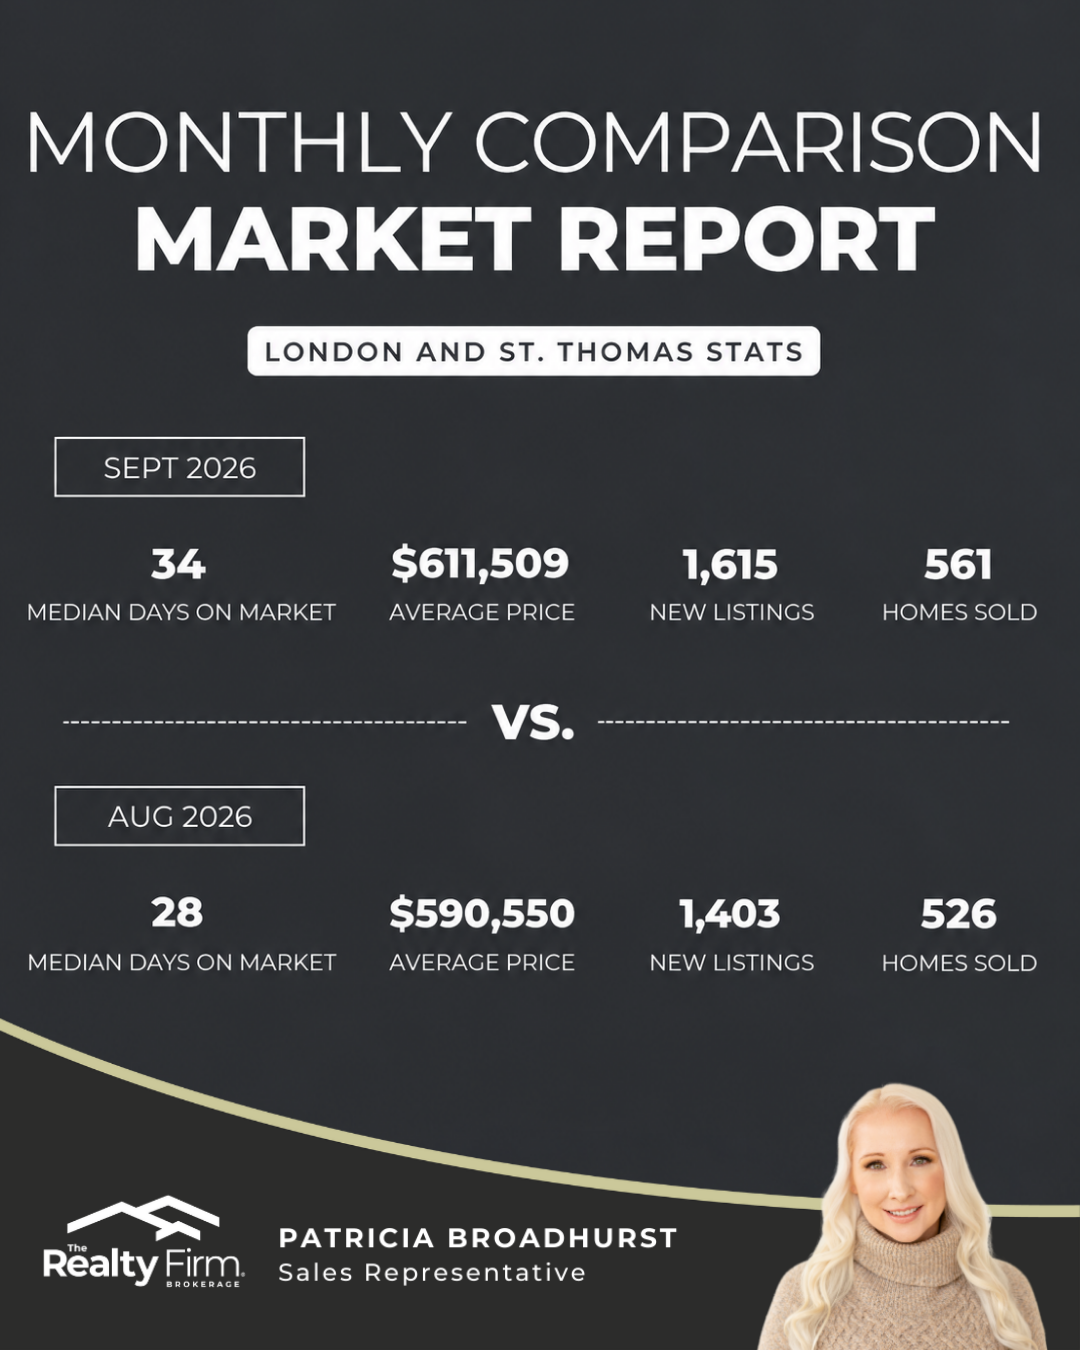
Average Sale Price: $611,509
The average sale price across London and St. Thomas was $611,509 in September 2026, representing a 1.9% decrease compared with 2025.
A decrease of 1.9% does not mean every home in London lost 1.9% of its value.
Average sale price is a broad market statistic. The actual value of an individual property depends on many factors, including its neighbourhood, property type, condition, lot, updates, features and current competition.
The regional price differences in this month's report demonstrate exactly why local context matters.
For homeowners considering selling, looking only at the overall London and St. Thomas average may not provide an accurate picture of what their individual home could sell for.
A local market analysis based on comparable properties is much more useful.
561 Homes Sold in September
One of the more encouraging indicators in September's report is sales activity.
A total of 561 homes sold, which represents a 5.3% increase compared with 2025.
That increase matters.
Even though the average sale price was slightly lower, more transactions were completed compared with the previous year.
For sellers, this is a reminder that buyers are still participating in the market.
However, buyers having choices means simply putting a property on the market does not guarantee a successful sale.
Pricing, presentation, condition and marketing continue to matter.
New Listings Declined 5.1%
There were 1,615 new listings during September 2026.
That was 5.1% lower than in 2025.
The number of new listings tells us how much new inventory entered the market during the period.
Fewer new listings combined with increased sales activity is worth watching in the months ahead.
However, one month of data should not be treated as a trend by itself.
Real estate markets change continuously, and conditions can vary substantially between neighbourhoods, price ranges and property types.
Months of Inventory: 5.9
September recorded 5.9 months of inventory, compared with 6.1 months in 2025.
Months of inventory is one way of looking at the relationship between the number of homes available and the current pace of sales.
In simple terms, it helps provide context for how much selection buyers have relative to demand.
The slight movement from 6.1 to 5.9 months indicates somewhat less inventory relative to the pace of sales than the comparison period.
For buyers, there is still value in understanding how much competition exists within the specific segment of the market they are considering.
For sellers, inventory is equally important.
Your home is not competing against the entire London market.
It is competing most directly against properties buyers consider reasonable alternatives to yours.
London Housing Prices Vary Significantly by Area
Perhaps one of the most useful parts of the September report is the difference between average housing prices across North, East and South London.
North London: $704,858
The average housing price in North London was $704,858, an increase of 2.8% compared with 2025.
Of the three London areas shown in the report, North London had the highest average price and was the only one showing an increase compared with the previous year.
North London includes a wide variety of communities and property types, so buyers should still look much more closely at the specific neighbourhood they are considering.
An area average provides useful context, but it is not a substitute for comparing similar homes.
East London: $456,814
The average housing price in East London was $456,814, representing a 9.3% decrease compared with 2025.
This was the largest percentage decrease among the three London areas included in the report.
Again, this does not mean that every property in East London declined by 9.3%.
Different types of properties sell each month, and the mix of sales can influence an area's average price.
If you own a property in East London and are considering selling, a property specific analysis is far more meaningful than applying the overall percentage change directly to your home.
South London: $608,872
In South London, the average housing price was $608,872, down 4.1% compared with 2025.
South London contains a broad mix of neighbourhoods, housing styles and price ranges.
That diversity makes it especially important to understand what is happening within the specific area and property category relevant to you.
What Does the September Market Mean for Buyers?
For buyers, the September numbers suggest there are still opportunities to approach the market thoughtfully.
With 5.9 months of inventory, buyers may have choices depending on the neighbourhood, property type and price range they are searching within.
That does not mean every property will have the same level of competition.
A well priced home in a desirable location can still attract considerable attention.
Rather than trying to time the entire market perfectly, buyers may be better served by focusing on the factors they can control:
Understanding their budget.
Having financing organized.
Identifying their preferred neighbourhoods.
Comparing recent sales.
Evaluating the condition of each property.
Understanding the terms of an offer.
And knowing what they are willing to compromise on before competition becomes part of the decision.
The best opportunity is not necessarily the home with the largest price reduction.
It is the property that makes sense for your finances, lifestyle and future plans.
What Does the September Market Mean for Sellers?
For sellers, the 5.3% increase in homes sold is encouraging, but the level of inventory means preparation remains important.
Buyers have access to information and can easily compare competing listings.
That makes the details increasingly important.
Pricing
Pricing a home significantly above comparable properties can make it difficult to generate early interest.
A strong pricing strategy should consider recent comparable sales, current competing listings, the condition of the property and current buyer activity.
Presentation
How a home appears online often determines whether a buyer decides to book a showing.
Professional photography, thoughtful staging, decluttering and appropriate preparation can help a property make a stronger first impression.
Marketing
A listing needs more than an MLS entry.
Strong property descriptions, digital marketing, social media, professional visuals and a strategy for reaching appropriate buyers can all contribute to the overall launch.
Flexibility
When buyers have more properties to choose from, sellers may also need to think carefully about showing availability, closing dates and other terms that could influence an offer.
Why Your Neighbourhood Matters More Than the City Average
The difference between North, East and South London is one of the clearest lessons from September's report.
The overall average sale price was $611,509.
But the area averages ranged from:
$456,814 in East London
to
$704,858 in North London.
That is a difference of more than $248,000 between the two area averages.
This is why statements such as "London prices are up" or "London prices are down" rarely tell the entire story.
Real estate is local.
And within a city, it becomes even more local.
Two homes with similar square footage can sell differently because of neighbourhood, school area, lot, renovations, property style, parking, nearby amenities and dozens of other factors.
Should You Wait to Buy?
There is rarely one answer that applies to every buyer.
If you are financially prepared, find a home that suits your needs and plan to own it for an appropriate period, current market conditions may provide opportunities worth exploring.
If your finances are uncertain or you are not sure where you want to live, waiting may make more sense.
Instead of asking:
"Is this the perfect month to buy?"
A more useful question may be:
"Is this the right time for me to buy?"
Those are very different questions.
Should You Sell in the Current Market?
The same principle applies to sellers.
Your decision should not be based exclusively on whether the overall average price increased or decreased this month.
Consider why you are selling.
Are you moving to another property?
Relocating?
Downsizing?
Selling an investment?
Changing your lifestyle?
Your next step matters just as much as your sale price.
For example, a homeowner selling and buying within the same general market may experience current conditions from both sides of the transaction.
Understanding the complete move can be more useful than focusing exclusively on one market statistic.
What Should Buyers and Sellers Watch Next?
As we move beyond September, several indicators will be worth watching.
Sales activity: Will the increase in homes sold continue?
New listings: Will fewer properties continue to enter the market?
Inventory: Will months of inventory continue to decrease?
Average prices: Will pricing remain relatively stable, decline further or begin moving upward?
Regional differences: Will North, East and South London continue to perform differently?
One month does not establish a long term trend, but watching these numbers over several reporting periods can help provide a clearer picture of the direction of the market.
Frequently Asked Questions About the London Ontario Real Estate Market
What was the average sale price in London and St. Thomas in September 2026?
The average sale price reported for September 2026 was $611,509, down 1.9% compared with 2025.
How many homes sold in September 2026?
A total of 561 homes sold, representing an increase of 5.3% compared with 2025.
How many new listings came onto the market?
There were 1,615 new listings in September 2026, down 5.1% compared with 2025.
How much inventory was available?
The report showed 5.9 months of inventory, compared with 6.1 months in 2025.
What was the average housing price in North London?
North London recorded an average housing price of $704,858, up 2.8% compared with 2025.
What was the average housing price in East London?
East London's average housing price was $456,814, down 9.3% compared with 2025.
What was the average housing price in South London?
South London's average housing price was $608,872, down 4.1% compared with 2025.
Understanding Your Local Market
September's numbers show why real estate market reports need context.
The overall average sale price declined slightly.
New listings decreased.
Sales increased.
Inventory moved from 6.1 months to 5.9 months.
And different parts of London experienced very different changes in average housing prices.
Rather than trying to make a buying or selling decision based on one headline number, look at the market that actually applies to your property, your neighbourhood and your goals.
If you are considering buying or selling in London, St. Thomas or the surrounding area, a property specific market analysis can provide a much clearer picture of where you stand.
Patricia Broadhurst, REALTOR®
The Realty Firm Inc., Brokerage
patricia@therealtyfirm.ca
www.PatriciaBroadhurst.com
519 494 3370
Serving London, ON & Area